There are many ways of getting work done. An effective way is to divide the work into manageable chunks, make a plan for these, and then focus on completing a chunk at a time.
If you are working in a (small) team, it is good to have a handy and simple system so that you can see what has to be done, and what has been completed. An effective tool is the Kanban board (Japanese for visual map). This was invented by a Japanese factory to control the stocks of raw materials during the production process. Nowadays, the Kanban board is also used in offices to provide an overview of the backlog of work.
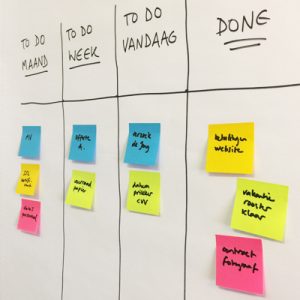
The Kanban board has three or four columns onto which coloured tickets (Post-it notes) are attached. Actions or tasks are written on the tickets, and the colours can be used to denote persons, teams or projects. In the left-hand column(s) are listed the tasks that still have to be undertaken in the coming week, or month. In the centre column are listed the components or sub-tasks (realistic actions taken from the task list); there can also be a column for actions for the day. In the right-hand column are the tasks that have been completed. By making this overview visible to the whole team, clarity is quickly achieved. By moving the tickets as a team every day (or week), problems can be quickly seen and solved.
A physical board can be replaced by digital visualization; see for example Kanbanflow or Trello, a free application for any computer. Or you can maken an Excel document, which is accessible for all team members.
You can use the Kanban board for other processes too: writing a joint text, organizing an event, renovating a building … try it!